Examples
The examples here show the typical results when comparing projects.
Example 1
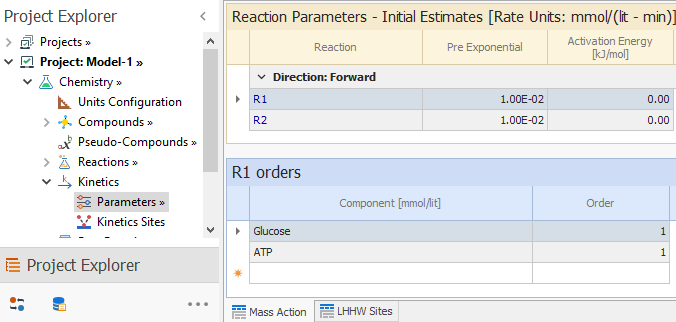
Suppose project Model-1 has two reactions, with data in node Chemistry → Kinetics → Parameters as follows:
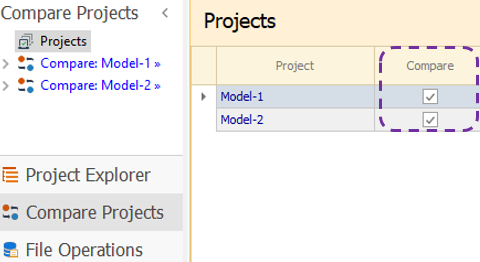
Lets say, project Model-2 only differs on the preexponential value of R1, which is 0.1 instead of 0.01.
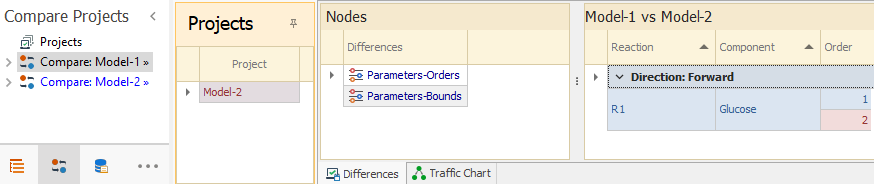
If you have selected those projects to be compared:
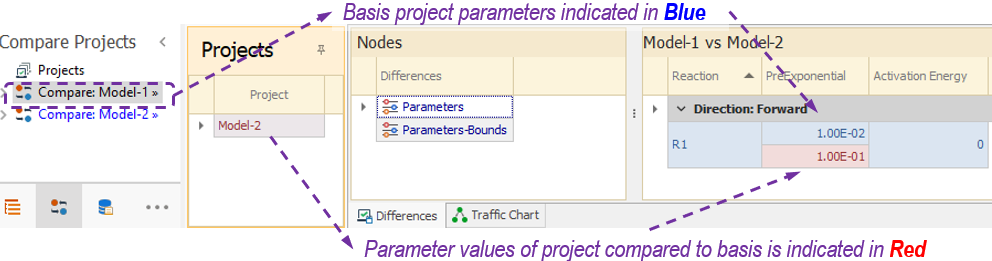
Then, we choose Model-1 as the basis of comparison by selecting it in the tree, and Model-2 in the Projects view to be compared with the basis.
Following that, the Nodes view contains the list of nodes where differences were found. We select Parameters node there:
The Nodes view shows all the nodes where differences have been found.
For this example, the Parameters row shows the difference of Preexponential and Activation Energies of Mass Action of Chemistry → Kinetics → Parameters node.
As the only difference for the projects in this example is the preexponential value of reaction R1, only that reaction is shown here.
The Preexponential column shows in blue font the value of the basis model and in red the value for the other model. All other columns are shown, even when there is no data difference for them. Thus, Activation Energy column is shown with a zero value in blue but without a value in red. That implies that the Activation Energy values are same for the whole block.
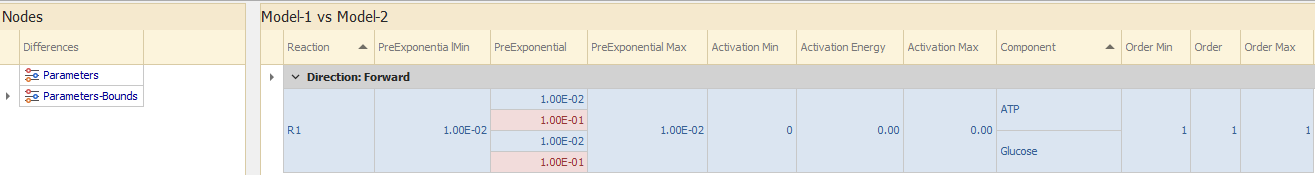
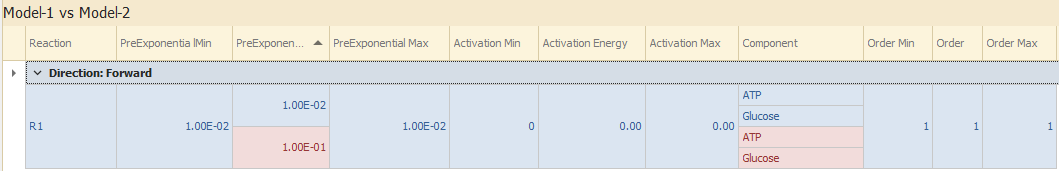
The difference in the preexponential value also affects the Estimation → Parameters node, for the Mass Action tab. As seen below, the preexponential values appear as differences, while the Min and Max bounds are the same.
As the rows are sorted by component, preexponential appears two times in red and two in blue. You can sort by Preexponential by clicking the column header to visualize differently as shown below:
Due to the different sorting, now Component names have different coloring, but they are not different. This happens because of the non-consecutiveness on the repeating compound in the rows. The point to note here is that values appearing in different colors does not necessarily imply that they are different between the projects.
Example 2
Consider project Model-2 that is same as Model-1 except that Glucose order in R1 is 2 instead of 1.
That difference is shown in Parameters-Orders as:
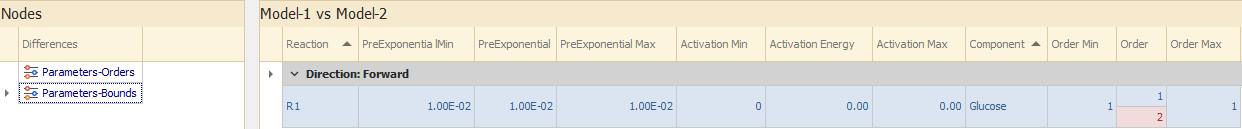
In Parameters-Bounds node, reaction R1 appears because it is the only reaction having differences in its parameters. Preexponentials and Activation Energies are same for the projects, but the columns are not hidden: a blue font with the repeated value is shown.
The Glucose order that is different is indicated with the blue/red font colors.
Example 3
Suppose two projects being compared have differences in node Estimation → Experiments → Sets, where the experimental data is loaded.
Project Model-1 has three sets {Set1, Set2, Set3} with four datapoints each, while Model-3 has also an additional set Set4.
Differences between the projects may appear as shown below:
From this node, we can gather the following information:
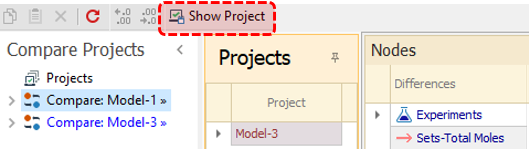
You may change the layout to sort by the project name.
In order to do that, please click on the Show Project toggle button on the toolbar:
Now you may click on the "Project Name" column header, and the display changes as shown below:
Suppose project Model-1 has two reactions, with data in node Chemistry → Kinetics → Parameters as follows:
|
|---|
Lets say, project Model-2 only differs on the preexponential value of R1, which is 0.1 instead of 0.01.
If you have selected those projects to be compared:
|
|---|
Then, we choose Model-1 as the basis of comparison by selecting it in the tree, and Model-2 in the Projects view to be compared with the basis.
Following that, the Nodes view contains the list of nodes where differences were found. We select Parameters node there:
|
|---|
The Nodes view shows all the nodes where differences have been found.
For this example, the Parameters row shows the difference of Preexponential and Activation Energies of Mass Action of Chemistry → Kinetics → Parameters node.
As the only difference for the projects in this example is the preexponential value of reaction R1, only that reaction is shown here.
The Preexponential column shows in blue font the value of the basis model and in red the value for the other model. All other columns are shown, even when there is no data difference for them. Thus, Activation Energy column is shown with a zero value in blue but without a value in red. That implies that the Activation Energy values are same for the whole block.
The difference in the preexponential value also affects the Estimation → Parameters node, for the Mass Action tab. As seen below, the preexponential values appear as differences, while the Min and Max bounds are the same.
|
|---|
As the rows are sorted by component, preexponential appears two times in red and two in blue. You can sort by Preexponential by clicking the column header to visualize differently as shown below:
|
|---|
Due to the different sorting, now Component names have different coloring, but they are not different. This happens because of the non-consecutiveness on the repeating compound in the rows. The point to note here is that values appearing in different colors does not necessarily imply that they are different between the projects.
Example 2
Consider project Model-2 that is same as Model-1 except that Glucose order in R1 is 2 instead of 1.
That difference is shown in Parameters-Orders as:
|
|---|
In Parameters-Bounds node, reaction R1 appears because it is the only reaction having differences in its parameters. Preexponentials and Activation Energies are same for the projects, but the columns are not hidden: a blue font with the repeated value is shown.
The Glucose order that is different is indicated with the blue/red font colors.
|
|---|
Example 3
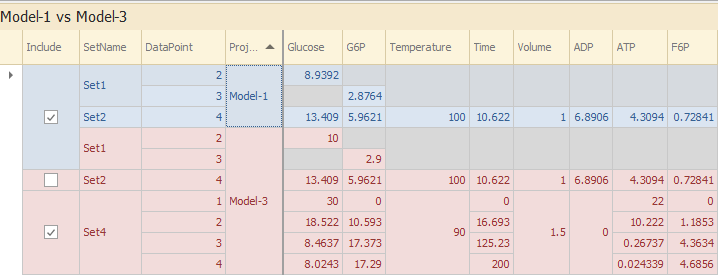
Suppose two projects being compared have differences in node Estimation → Experiments → Sets, where the experimental data is loaded.
Project Model-1 has three sets {Set1, Set2, Set3} with four datapoints each, while Model-3 has also an additional set Set4.
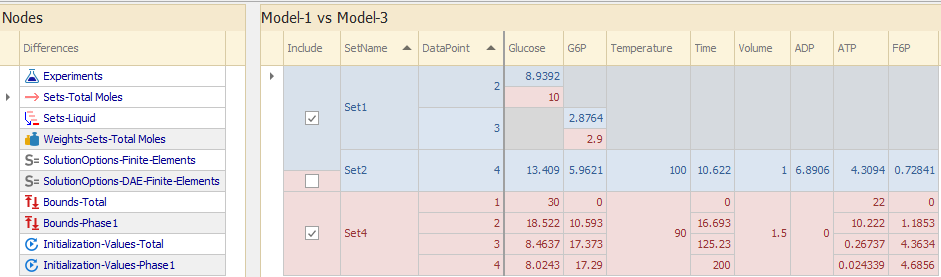
Differences between the projects may appear as shown below:
|
|---|
From this node, we can gather the following information:
- Set1:
- Compound Glucose at Datapoint=2 is different as indicated with the blue/red fonts: 8.9392 in Model-1 while 10 in Model-3. For this Datapoint, all other cells with grey color mean that their values are the same in both projects.
- Compound G6P at Datapoint=3 is different.
- Set2: Datapoint=4 is included in Model-1 but not in Model-3. That is the only difference.
- Set4: All Datapoints are shown only in red. That means that the set is only available in Model-3, but not in Model-1.
- All Sets and Datapoints not shown here have the same data for all columns. That is why Set3 does not appear. Likewise, Datapoint=1 of Set1 is not shown.
In order to do that, please click on the Show Project toggle button on the toolbar:
|
|---|
Now you may click on the "Project Name" column header, and the display changes as shown below:
|
|---|
Top of Topic
See Also: